greenandblack
greenandblack
My ID: The gh-pages branch root folder file called index.md.
Navigation links
- …from the top, nice format, github
- …the backing lexicon, nice format, github
Contents
Green and black…
Nice format! What’s your secret?
This repo uses GitHub’s gh-pages service: Built as a distinct gh-pages branch off the default Main.
gh-pages uses a jekyll template, whatever that is. There are, as a result, three places to be:
- The main branch of the github repo
- The gh-pages branch of the github repo
- The pretty documentation website
Here is how to get one of these https://organization.github.io/repo websites started:
- Create some repository on GitHub
- Menus: Github –> repo –> Settings –> pages tab on the left; choose a theme
- Switch to the
gh-pagesbranch: From theMainbranch, use the chooser - At the documentation site it will be
index.mdthat renders (not a README)- Edits can be a little slow to propagate; refresh!
- The root directory
index.mdrenders as default content- Add other folders and markdown; but cross reference using documentation website URLs, not GitHub URLs
- Example:
https://organization.github.io/repo-name/subfolderrenders theindex.mdtherein
- Example:
- Add other folders and markdown; but cross reference using documentation website URLs, not GitHub URLs
motivating rant please?
I want to understand–say–my Linux bash installation on my Windows laptop… and I want simple green text on a black background. Not a lot of ‘informative’ colorized text. I did it once… long ago… but there were all these squonking little details. Every two years or so, give or take, I have to drag through the same piddly little web searches and glaring my way through Stack Overflow answers…rrrrrr… You know what this is? This is the curse of having a semi-IT job while being a not-very-IT personality. So I put in some extra effort on these notes and every couple years they will save me… hours? days? minutes? of teeth gnashing.
Just make it green and black
Intro
The scenario:
- I am working on a PC running some (say Windows Subsystem for Linux (WSL))
bashshell - …and I am peering into another machine, say a Virtual Machine…
- …where unhappily it’s nauseating colorized text…
- …in both the
bashshell and thevieditor… - …and it builds some byzantine prompt…
- …but all I want is green on black with a simple prompt…
This bias was inspired by this guy Curtis, who is cool nevermind late to rehearsal.
Everything I know about git
git pullto get the latest; thengit add .thengit commit -m 'ch ch ch changes'thengit push- From
~store creds usinggit config --global credential.helper store - To abandon changes and back up:
git reset --hard HEADor if necessarygit reset --hard HEAD~1etcetera- HEAD~n means n commits back
bash fix
Let’s begin on the Ubuntu bash shell running on a Windows PC. This can be customized; independent of customizing a VM bash.
- Run the Ubuntu bash shell
- From the top window bar: Right click, select Properties, and set Color to green on black
- Increase font size, adjust whatever else you like
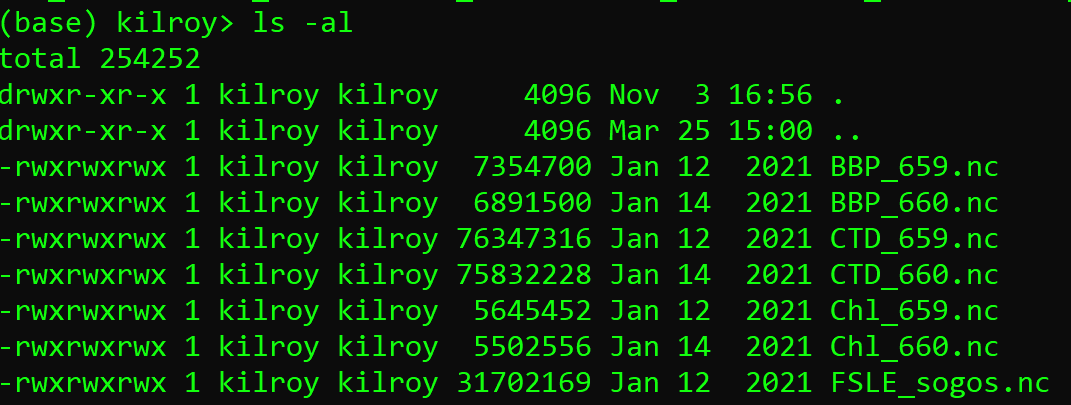
- Type
ls -alto observe that color support is still enabled. Yeccch. - Comment out these lines in
.bashrc
# enable color support of ls and also add handy aliases
#if [ -x /usr/bin/dircolors ]; then
#    test -r ~/.dircolors && eval "$(dircolors -b ~/.dircolors)" || eval "$(dircolors -b)"
#    alias ls='ls --color=auto'
#    #alias dir='dir --color=auto'
#    #alias vdir='vdir --color=auto'
#
#    alias grep='grep --color=auto'
#    alias fgrep='fgrep --color=auto'
#    alias egrep='egrep --color=auto'
#fi
- Command line:
source ~/.bashrc - Check with
ls -alagain
green text
For green text type this on the command line: echo -e "Default \e[32mDefault"
prompt fix
The prompt’s job is to tell me which computer I am entering commands on (and possibly whether I am working inside a conda environment).
- Edit
~/.bashrc' invi, scroll past the$PS1` stuff$PS1is a variable for the default bash prompt
- Add this line:
PS1="my computer> "
- Command line:
source ~/.bashrc
Now the prompt tells me when I am working on my local machine. For VMs: Use simple but instructive prompts in like fashion.
A conda environment name will be prepended to this bash prompt. By default this
prompt will be (base) my computer> . This is ok by me: When I switch
environments by means of conda activate some-environment the prompt will
automatically change the prompt to (some-environment) my computer>.
ls fix
To change the colors of the text produced by ls check an online resource like this.
The bare-bones to make directory names green is like so:
dircolors -b >> .bashrcappends the current ls color scheme to.bashrc- edit
.bashrcand go to the end of the file - Observe the dense text we just added:
LS_COLORS=`rs=0:di=01;34....etcetera etcetera etceters....;export LS_COLORS`
- These are key-value pairs.
- The color green is ‘32’ so find the entry for
di(directory) and set it todi=01;32. source ~/.bashrcls -al
vi fix
vi and vim are the same editor, specificially an ancient text editor
with arcane syntax inherited from an even older editor called ed. vim
is the modern version of vi.
To disable a profusion of colorized text in vi: In escape mode type :syntax off.
To disable a profusion of colorized text permanently:
vi ~/.vimrc

<escape>
G
o
syntax off
<escape>
:wq
- Re-run
vito verify this worked
What is the point of conda environments?
conda create/activate commands engage Python environments as customized versions of
our base environment.
- Needed: How does the current environment appear in the Jupyter notebook server interface?
ssh tunnel
Outline
I want to run Jupyter on a secure VM inside the AWS cloud on a private subnet. Let’s call this VM worker.
I have an intermediary bastion server called bastion. I’m going to connect from my local machine to
bastion to worker so that in my browser I see a Jupyter notebook server that is in fact running on worker.
That means a two-hop ssh tunnel.
Procedure
If bastion has a moving target public ip address: Assign it a fixed ip address. For example on AWS
this is called an elastic ip. Now that ip address can be baked into a connect alias.
- From
localbash:
$ ssh -i bastion.pem ubuntu@12.23.34.45
- Customize the environment… I hear green and black is nice
- From
local: Move theworker.pemfile tobastion
$ sftp -i bastion.pem ubuntu@12.23.34.45
sftp> put worker.pem
sshfromlocaltobastiontoworkerssh ubuntu@12.23.34.45 -i bastion.pemssh -i worker.pem ubuntu@10.0.1.234- This uses the VPC private subnet ip address for
worker
- This uses the VPC private subnet ip address for
- On worker start a headless Jupyter notebook server
(jupyter notebook --no-browser --port=8889) &- The choice of port is fairly arbitrary; but we do not want it to collide with a port that is in use
- This command produces a lot of output
- Towards the end: copy the long token string
- It looks like
4109891ab3e0ec38c2aec9c427c8be11eda975ab2882a52a
- It looks like
exit- First time doing this: Log back in to
workerand verify the server is still runningps -ef | grep jupyterexit
- On
bastioncreate an ssh tunnelssh -N -f -i worker.pem -L localhost:7005:localhost:8889 ubuntu@10.0.1.234- Same as above remark: On port choice 7005
- This command associates inbound
bastiontraffic on port 7005 to outbound >workerport 8889
exit
- On
localcreate the second part of the tunnel tobastionssh -N -f -i bastion.pem -L localhost:7004:localhost:7005 ubuntu@12.23.34.45
localbrowser address barlocalhost:7004- If promnpted: paste in token string copied above
bash
List volumes for only top-level directories
du -h -d1
CPU monitoring (many-core machine)
Wes says: “Use top from the bash command line.”
Wes says: “CloudWatch metrics (AWS EC2 console GUI) are delayed, updated once every 5 minutes. A localized spike in CPU use will take some time to display in the console. It is possible to pay for a higher sampling rate in the console… but why?”
Keep a VM patched
sudo apt-get update -y && sudo apt-get upgrade -y